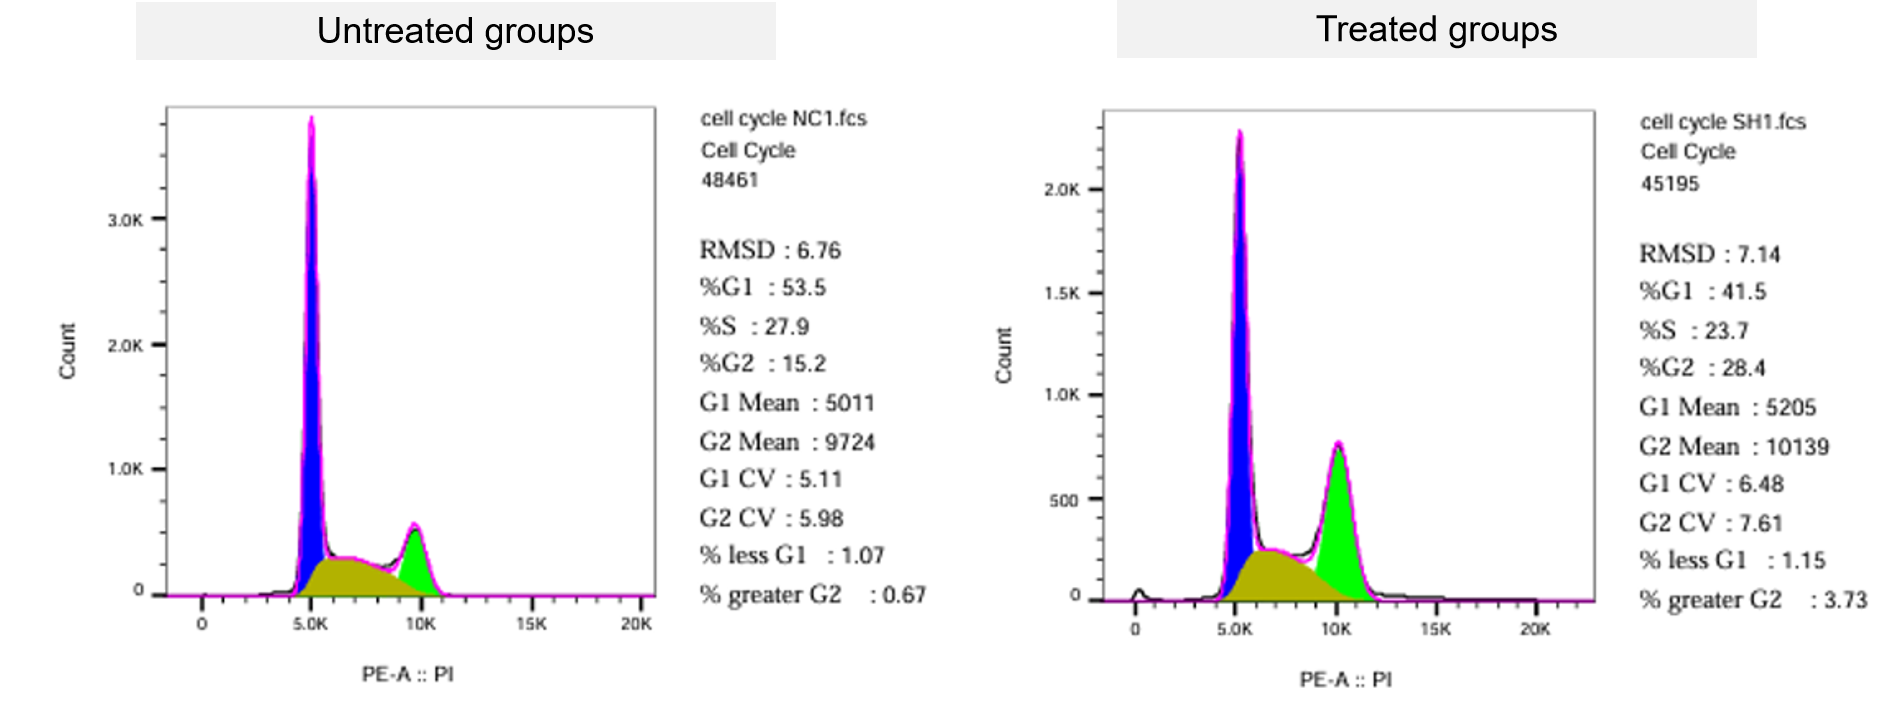
Cell cycle distribution of treated and untreated BCPAP cells was determined by flow cytometry, and the data were analyzed using dedicated curve‑fitting software. The resulting histograms exhibited clear and well‑resolved peaks corresponding to each cell cycle phase. In the untreated group, the cell cycle distribution was as follows: G1 phase, 53.5%; S phase, 27.9%; G2 phase, 15.2%. In the treated group, the distribution was: G1 phase, 41.5%; S phase, 23.7%; G2 phase, 28.4%.
更多